Written by Billy Downing
Overview
When an organization decides to deploy its containerized application on to Kubernetes, there is always the question of one cluster for all or one cluster per application. While those two options showcase extreme circumstances, the number of clusters, and how they are allocated is always a question that needs to be addressed. As Kubernetes deployment toolsets become more production hardened and lifecycle management projects reach later stages within the Cloud Native Computing Foundation (CNCF), more infrastructure teams and developers are testing a multi-cluster approach using a higher-level orchestration system to create a cohesive environment. In this discussion, we will walk through VMware’s solution to the multi-cloud, multi-cluster Kubernetes approach using Tanzu Mission Control (TMC) as the higher-level management-plane.
Here are a few of the benefits of building a multi-cluster environment:
- Distributed control-plane localized per cluster
- Ability to provision purpose-built clusters based on needed characteristics in performance, security, etc.
- Hard boundaries of segregation between clusters and therefore workloads
- Significantly lower impact radius for cluster-wide outages or problems
- Ability to provision clusters of various versions to test new features
Problem
Using several smaller to medium-sized clusters that separate fault domains and create hard separation points, comes with benefits over a single cluster broken into namespaces. This action results in the cost of management complexity. This is especially true whenthe intention of creating several clusters is made for the purpose of spreading applications across multiple public clouds or deploying clusters in a hybrid cloud approach between a private and a public cloud. For those instances, it becomes very difficult to apply the common policy, orchestrate lifecycle management, and observe health status’. This problem has been solved most commonly by taking a ‘manager of managers’ approach and adding another management-plane to aggregate all clusters. While each individual Kubernetes cluster provides a central point of management for application workloads, Tanzu Mission Control (TMC) provides a centralized point of orchestration for clusters themselves as workloads.
Multi-Cluster Problems:
- Management complexity
- Ability to apply common policy across clusters
- Centralized visibility into the disparate cluster’s across multiple platforms
- Lifecycle of all clusters
Solution
In this case, our solution is Tanzu Mission Control, VMware’s Kubernetes cluster orchestration Software-as-a-Service offering. Tanzu Mission Control acts as the manager of managers for all of your Kubernetes clusters across public and private clouds.
Solutions to Multi-Cluster Problems:
- Centralized management through a SaaS-based offering in TMC by attaching clusters to TMC and adding an extension, agents, and webbooks
- Create and invoke policy from centralized controllers across clusters
- Create pod security, image registry, access, network, and resource policies across multiple groups of clusters
- Provide visibility by establishing an aggregate interface for cluster health and metrics through agents running as deployments within each cluster and integrating a log aggregation system using Tanzu Observability by Wavefront into the system
- Lifecycle clusters by facilitating the creation and upgrade capabilities with ClusterAPI, conformance scanning through Sonobuoy, and backup with recovery via Velero
Day 1 Usage
Now that the stage is set, our solution requires us to deploy a micro-service based containerized application in such a way that it is properly resilient to failure and distributed across a hybrid on-prem/AWS environment. We’ll use Kubernetes to house the workloads themselves then separate each application into its own namespace and use Tanzu Mission Control to aggregate our multiple clusters into a single management plane. Figure 1 displays the first step in aggregating our multi-cluster environment, with the two clusters we’ll focus on here being aws-eks-02 (Amazon Elastic Kubernetes Service) and tkc-2 (VMware Tanzu Kubernetes Cluster). The EKS cluster was deployed directly using the TMC console, while the TKC cluster is one deployed by vSphere with Tanzu on vSphere 7 update 1 and then attached to our TMC instance.
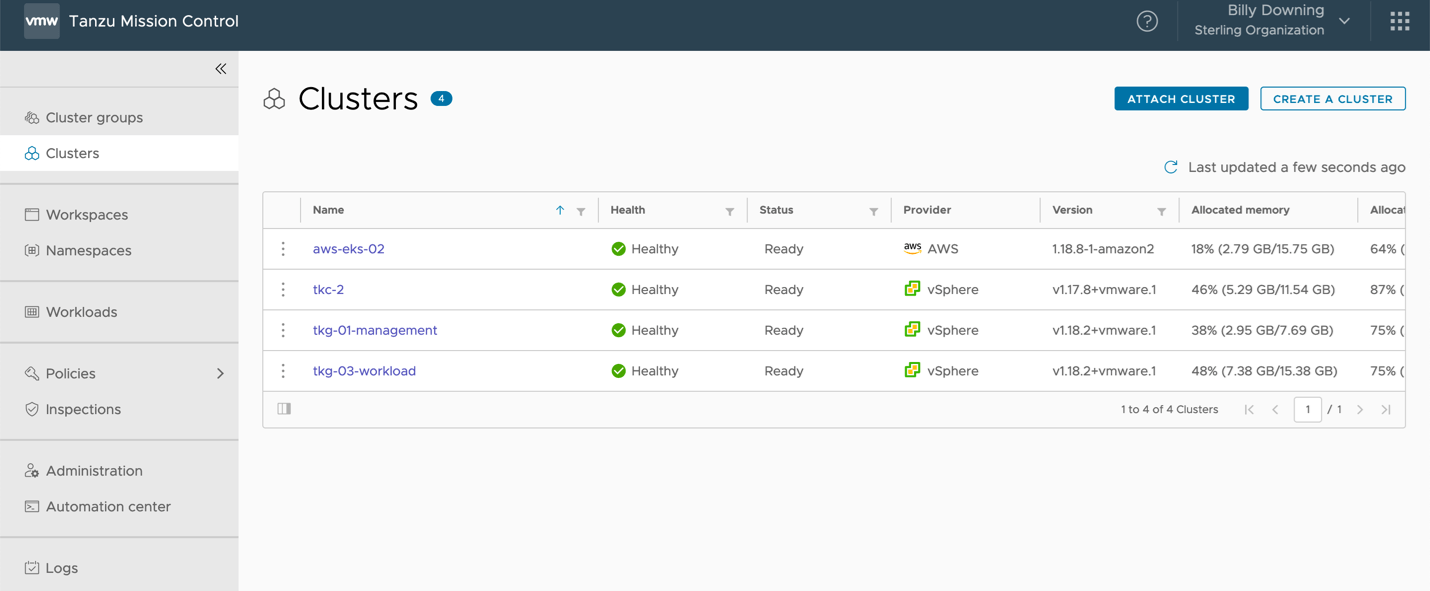
Figure 1: All Clusters Managed by Tanzu Mission Control
Once we have clusters pulled into our TMC instance, we can start grouping them and applying the policy. For the operations teams, we’ll start by grouping each actual cluster into appropriate groups to late apply the policy to. Since AWS and vSphere may have different teams managing them, or require different constraints, it would make sense to create an individual group per cluster. If we add clusters to either environment later, we can add them to these groups and have our policy automatically applied. Figure 2 shows that we’ve created an AWS and TKG group to house our clusters separately.

Figure 2: Tanzu Mission Control cluster grouping
At this point, we’ve placed two clusters into management control of TMC, and grouped those clusters based on their platform. The next step is to group out clusters based on applications to apply policy directly to the appropriate namespaces within each cluster. This could be, for example, if a namespace is dedicated to an application team then a majority of the same security policies would apply regardless of the cluster in which that namespace and application is provisioned. TMC affords us the ability to abstract away cluster specifics and create workspaces made from the namespace perspective and agnostic across clusters. I do want to note that this is not the same as hierarchical namespaces but acts in a way to centralize policy not from the cluster perspective, but from the namespace purview.
Using TMC, we can actually create the namespaces we’d like to then group. In this scenario, we’ve created two namespaces one for each cluster for which to allocate access to for a specific set of developers. Sterlingblog-eks for the EKS cluster, and sterlingdemo-tkg for the vSphere with Tanzu cluster. Now that we have managed namespaces, much like how we attached clusters to the instance and grouped them, our next move is to group these namespaces (across multiple clusters) into a single workspace, as shown in Figure 4 with the sterlingdemo workspace.
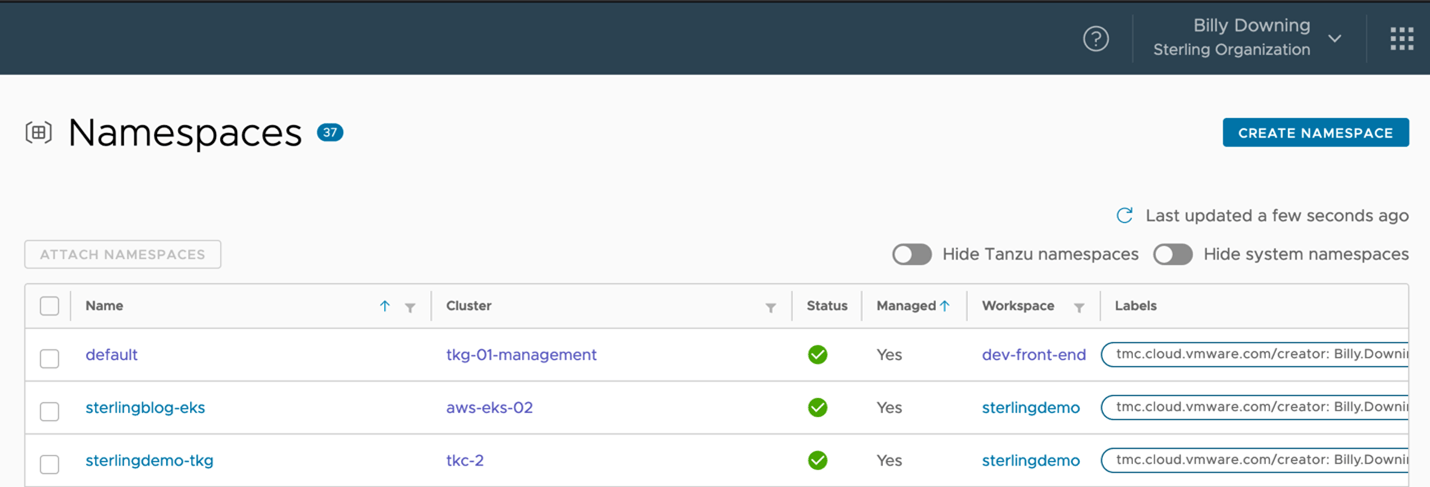
Figure 3: Namespaces that are managed by Tanzu Mission Control
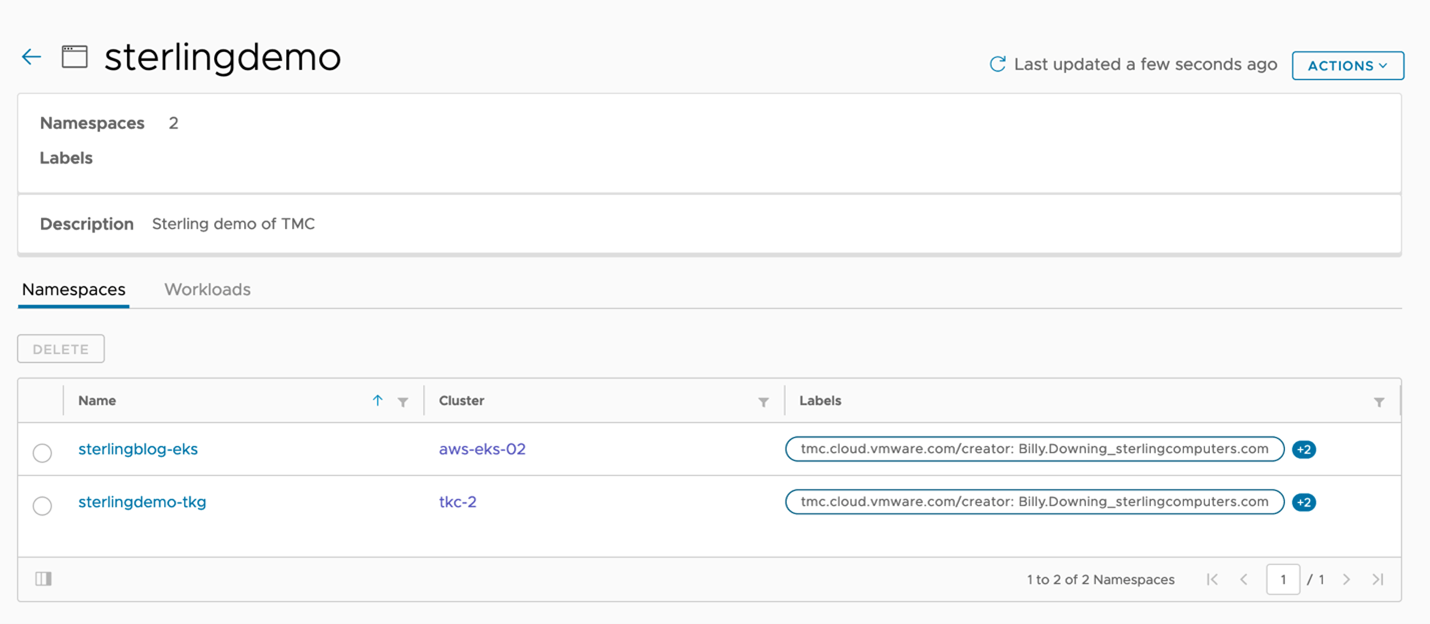 Figure 4: Tanzu Mission Control managed namespaces grouped together in workspaces
Finally, we have our clusters attached, provisioned, and grouped for the operations teams, and our namespaces allocated and grouped for our application teams. We’ll now take a look at the policy engine within TMC to secure our clusters and applications with conformity without having to individually apply anything to a single cluster. Figure 5 reviews some of the policy types we can create and allows us to apply them to either a cluster group or workspace. For example, in Figure 5 we’ve created an access policy to determine who can access our sterlingdemo workspace. Since the workspace contains two namespaces the policy will be applied in all relevant clusters.
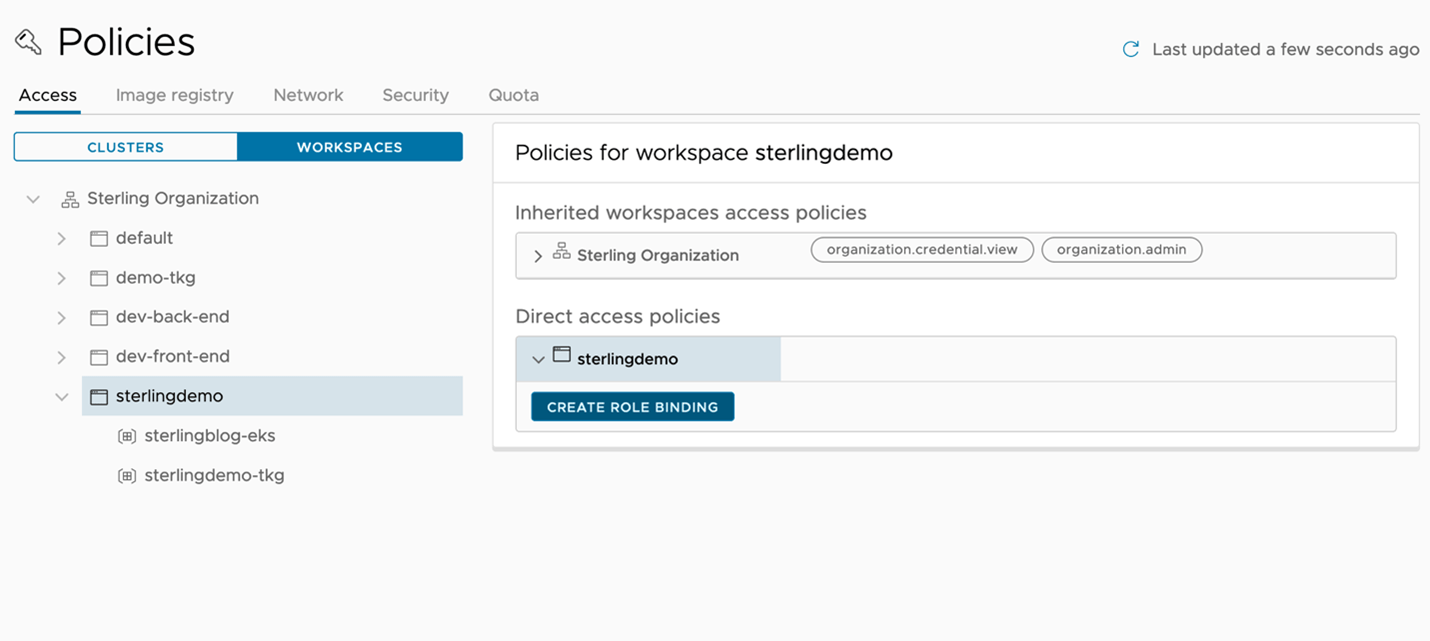 Figure 5: Creating an access policy and applying it to workspaces
Day 2 Usage
At this point, we’ve done the following
- Deploy an Amazon EKS cluster, and attach a vSphere with Tanzu Kubernetes Cluster to our Tanzu Mission Control instance
- Grouped the clusters based on the provider (AWS and vSphere) for the operations team
- Created and grouped namespaces in each cluster as the workspace for our application team
- Applied an access policy to allow the application team permissions into the workspace of grouped namespaces
Now the application team has the tools needed to go ahead and start deploying applications, and the operations team has some insight and control over how clusters are handled. The next step is to ensure the operations team maintains observability into cluster metrics and health checks, and application teams have insight into their workloads. Tanzu Mission Control has a native dashboard for cluster health checks, as shown in Figure 6, which provides at-a-glance type checks for overall cluster health.
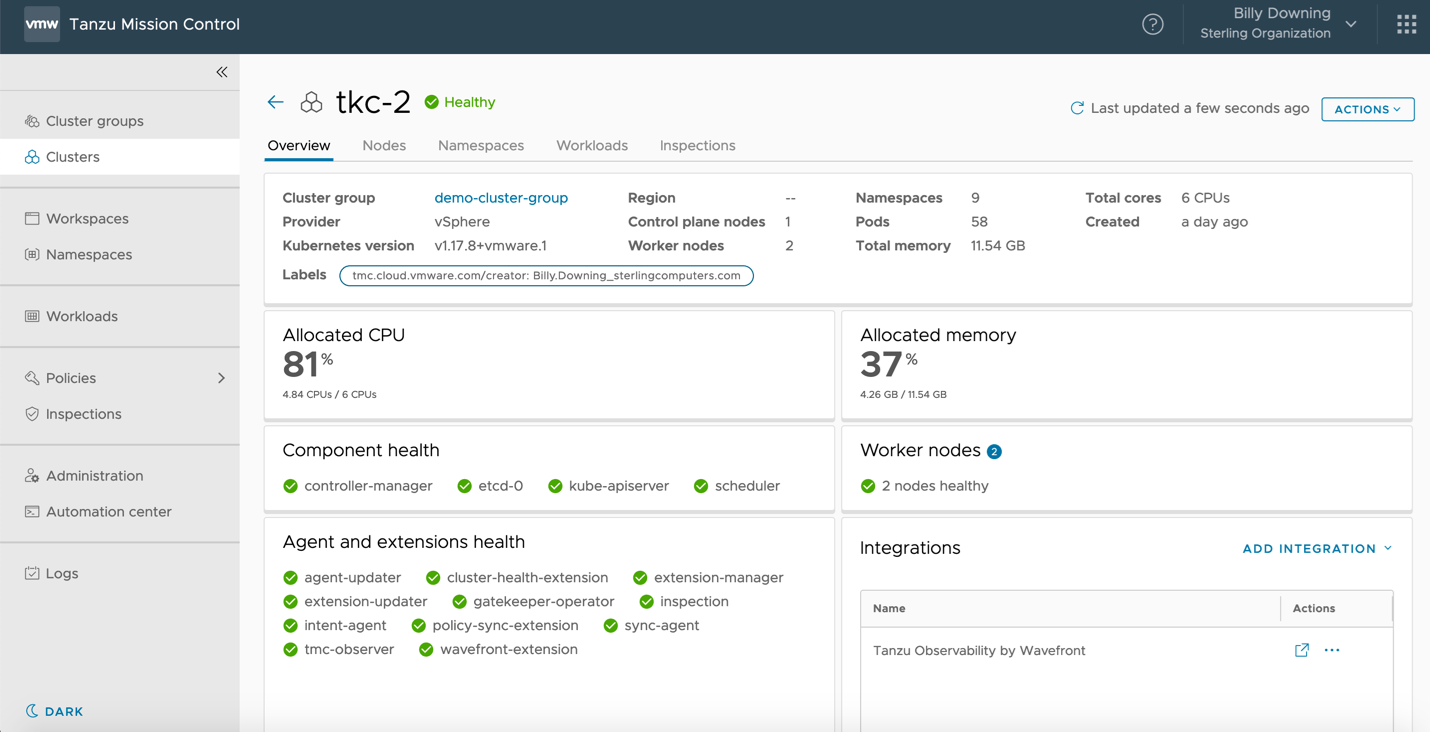
Figure 6: Tanzu Mission Control cluster health dashboard
TMC also provides a direct integration into Tanzu Observability by Wavefront which provides us the capability to automatically deploy the agents required to export all our deep granular metrics from our clusters. These metrics provide more than just general health checks, but also an insight into application behaviors, network capacity, storage usages, and so forth as shown in Figures 7 and 8.
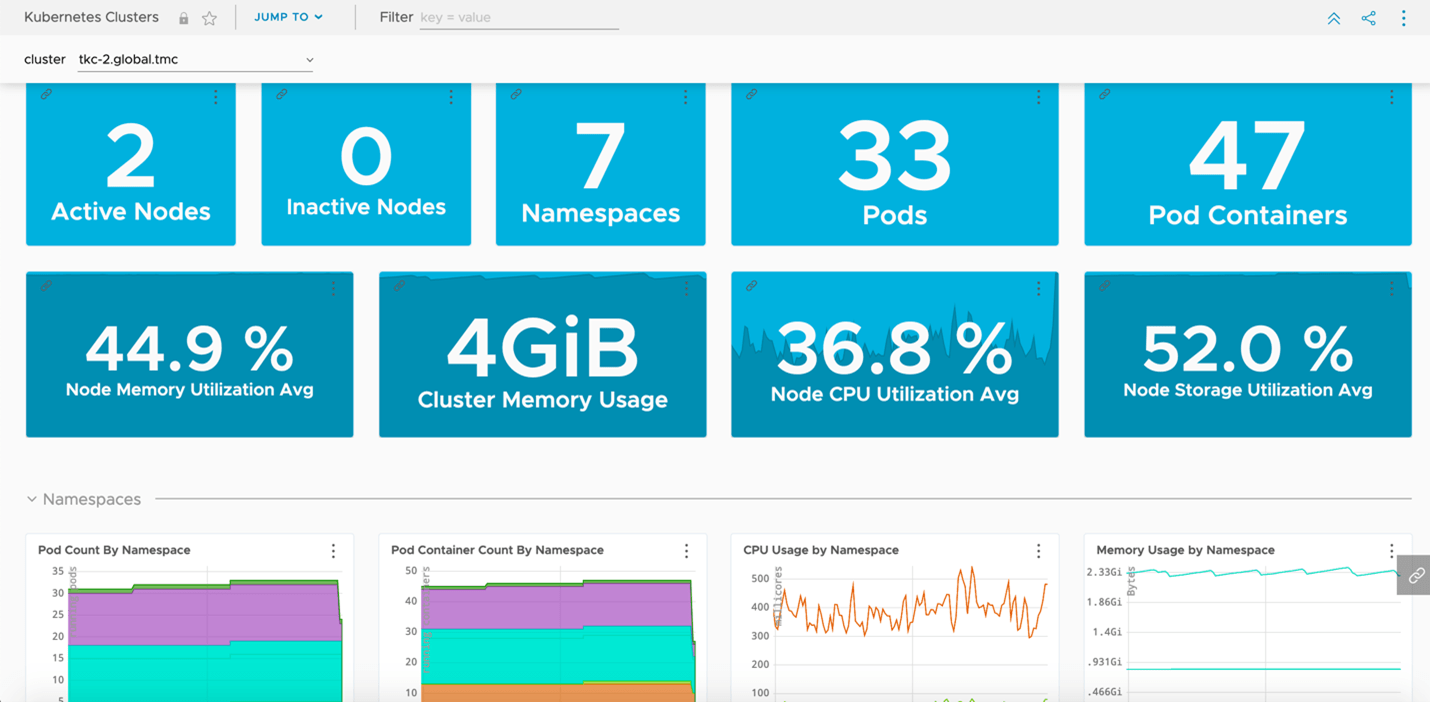 Figure 7: Metrics imported into Tanzu Observability focusing on cluster health in depth
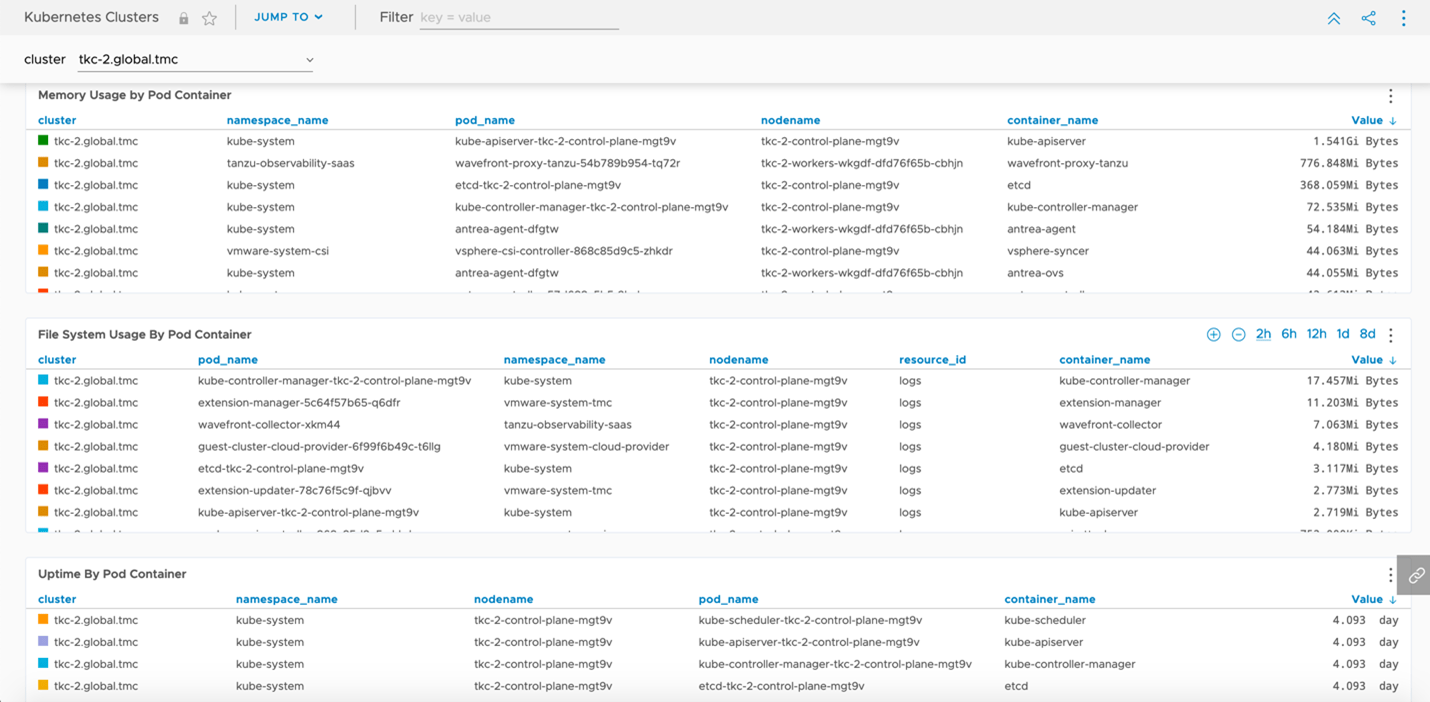
Figure 8: Metrics imports into Tanzu Observability focusing on pod specific metrics
Summary
Straightaway after deploying our clusters, we’re at a point where we’ve provided our applications teams a platform to run their resilient, containerized, hybrid cloud workloads while maintaining centralized control, lifecycle management, observability, and policy creation. Tanzu Mission Control provides several other benefits not mentioned here, but we’ve dug under the surface of how an actual implementation could look and ties our solution together. While it may seem daunting to tie together resources and objects from the various environments, and potentially manage thousands of clusters, Sterling has made the investment in time and education building scalable solutions to efficiently build, manage, and run business-critical applications. If you’re interested in exploring new solutions for cloud-native applications, contact Sterling to set up a demonstration of this solution and focus on the aspects that matter most.
References:
Tanzu Portfolio Splash Page: https://tanzu.vmware.com/mission-control
Sonobuoy: https://sonobuoy.io/
Velero: https://velero.io/
Amazon AWS EKS: https://aws.amazon.com/eks/
Cloud-Native Compute Foundation (CNCF): https://www.cncf.io/
vSphere with Tanzu: https://blogs.vmware.com/vsphere/2020/09/announcing-vsphere-with-tanzu.html
Tanzu Observability by Wavefront: https://tanzu.vmware.com/observability
